
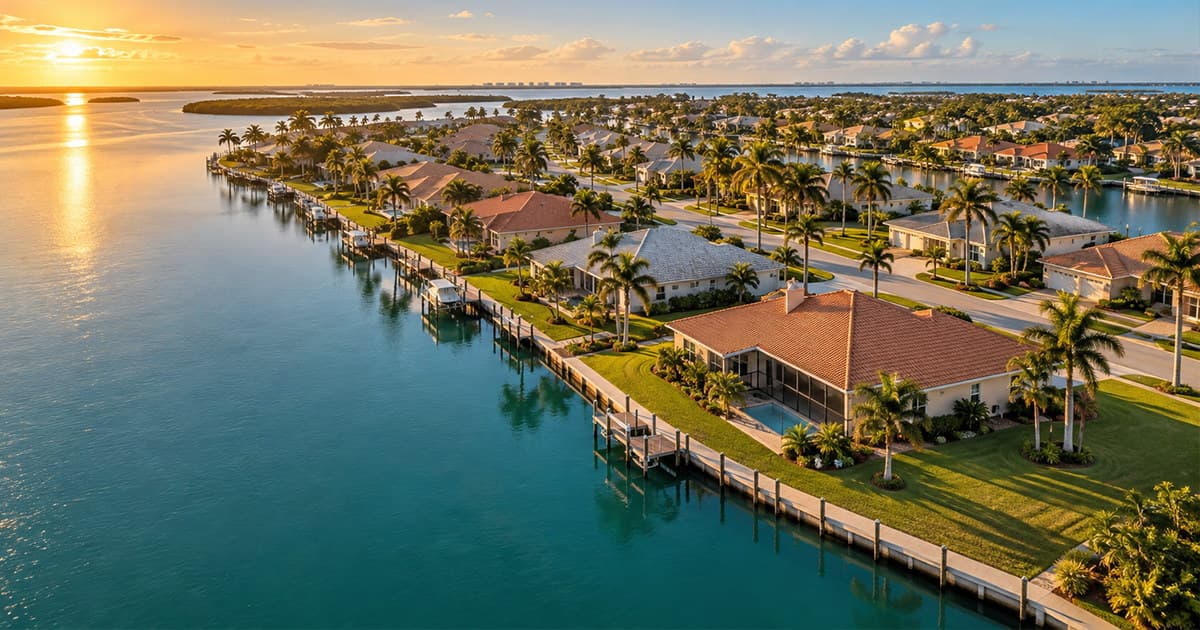
Which direction is Florida's for-sale inventory actually moving? Ask around this year and you will mostly get the crash answer: a flood of listings, trapped sellers, no buyers. The Florida Gulf Coast housing inventory numbers say something different. Across Lee, Collier, Sarasota and Pinellas counties, the count of homes sitting unsold has fallen in every month of 2026 against the same month a year earlier.
That is not the same as saying the correction is over. Asking prices in all four counties are still below where they were a year ago, and far below their 2022–2023 peaks. Both things are true at once, and the combination is what matters if you buy, sell or list property on this coast.
What the August numbers show
Every figure below is the August 2026 reading against August 2025, drawn from Realtor.com's Housing Inventory Core Metrics as published by the Federal Reserve Bank of St. Louis. The series are not seasonally adjusted, which is precisely why each comparison here is same-month, year over year rather than month to month.
| County | Active listings | Pending sales | Median days on market | Median asking price |
|---|---|---|---|---|
| Lee | 11,161 → 9,351 (−16.2%) | 2,190 → 2,399 (+9.5%) | 106 → 95 | $405,000 → $380,000 (−6.2%) |
| Collier | 5,556 → 4,676 (−15.8%) | 987 → 1,093 (+10.7%) | 120 → 106 | $699,000 → $685,000 (−2.0%) |
| Sarasota | 4,965 → 4,030 (−18.8%) | 1,321 → 1,579 (+19.5%) | 106 → 94 | $479,950 → $460,000 (−4.2%) |
| Pinellas | 7,443 → 6,607 (−11.2%) | 1,740 → 1,860 (+6.9%) | 85 → 85 | $440,000 → $420,000 (−4.5%) |
| Florida (statewide) | 166,560 → 146,977 (−11.8%) | 41,421 → 44,416 (+7.2%) | 87 → 81 | $429,900 → $414,900 (−3.5%) |
Four of the five metrics moved the way a tightening market moves. Only the price column did not.
The glut peaked in spring 2025, not this year
The inventory build that defined the last three years did not end in 2026. It ended the spring before, and 2026 has been the drawdown.
| County | Peak active listings | August 2026 | Off peak |
|---|---|---|---|
| Lee | 14,616 (March 2025) | 9,351 | −36.0% |
| Collier | 8,358 (April 2025) | 4,676 | −44.1% |
| Sarasota | 6,803 (April 2025) | 4,030 | −40.8% |
| Pinellas | 8,214 (May 2025) | 6,607 | −19.6% |
| Florida (statewide) | 182,593 (April 2025) | 146,977 | −19.5% |
The drawdown has also been uninterrupted. Lee and Collier have come in under their year-earlier figure in every month since January 2026; Sarasota and the state as a whole since February; Pinellas County since March. Eight consecutive months of year-over-year decline is not a seasonal wobble.
Why "sellers gave up and delisted" does not explain it
There are two ways a listing leaves the active count, and they mean opposite things. The seller can go under contract, or the seller can withdraw. A shrinking inventory on its own cannot tell you which happened — and the withdrawal story is the one most people reach for in a soft market.
The pending column settles it. Realtor.com counts active listings and pending listings separately, with pendings expressly excluded from the active figure. Pending sales rose year over year in all four counties and statewide — up 19.5% in Sarasota County, 10.7% in Collier County, 9.5% in Lee County. More homes went under contract this August than last August, from a smaller pool.
Price-cut counts point the same way. The number of listings with a price reduction fell 27.1% in Sarasota, 25.5% in Collier, 14.9% in Pinellas and 14.0% in Lee. Fewer homes on the market, more of them under contract, fewer needing a cut, and a shorter wait to sell. That is absorption, not abandonment.
Three caveats belong with those numbers, because they are the ones most market commentary skips. These are asking prices, not sold prices — the two can drift apart for months. A median asking price also shifts with the mix of what happens to be listed, so a quarter with more entry-level inventory will print a lower median without any individual home losing value. And because the series carry no seasonal adjustment, only same-month comparisons across years mean anything.
Pinellas is not moving with the other three
Group the four counties together and you lose the most useful detail in the data. Pinellas is the outlier on every measure of tightening.
Its median days on market did not improve at all — 85 days in August 2025, 85 days in August 2026 — while the statewide figure fell from 87 to 81 and Collier shed two full weeks. Its inventory drawdown from peak is 19.6%, roughly half of Lee's and well under half of Collier's. Its pending-sales gain was the smallest of the four.
Part of that is simply where Pinellas started: at 85 days it was never as congested as Collier at 120. But it is the one county of the four that has not tightened over the year, and an investor who reads "the Gulf Coast is clearing" and applies it to Pinellas the way they would to Lee is working from the wrong number.
What a thinner market changes for investors and agents
Two practical consequences follow, and they pull in different directions.
The first is that a large part of the discount is already in the asking price. Lee County's median asking price peaked at $499,450 in June 2022 and stood at $380,000 in August 2026, 23.9% lower. Collier fell 23.9% from its May 2023 peak of $899,748, Sarasota 22.9% from $597,000 in May 2022, Pinellas 14.1% from $489,000 in July 2023. Waiting for a bottom has a cost now that absorption has turned.
The second is that the on-market funnel is getting smaller. There are 16% fewer active listings in Lee than a year ago and 19% fewer in Sarasota, while more buyers are competing for them. Whatever else a shrinking inventory does, it means less to look at and more people looking.
The part of the market that does not shrink when inventory does is the part driven by an owner's circumstances rather than their timing. Estates, divorces, foreclosure filings and eviction filings keep arriving at the courthouse on their own schedule, and they are indifferent to months of supply. That is the whole argument for working Florida probate leads, divorce leads, pre-foreclosure leads and eviction filings alongside whatever is listed — and it matters more in a tightening market, not less. For wholesalers and fix-and-flip buyers it is where deal flow comes from when the listing pool thins; for listing agents it is where the next listing comes from before it reaches the MLS.
If you want the related reading, our analysis of Florida's foreclosure rate covers the distress side of the same market, and Florida homeowner tenure looks at how long the owners behind estate filings have actually held their homes.
PocketLeads covers Lee, Collier, Sarasota and Pinellas counties, with more on the way, and delivers Florida court filings the same day. Start your free trial to see what is filing in your county this week.
Frequently asked questions
Is Florida's Gulf Coast still a buyer's market?
It is less of one than it was a year ago. Active listings in Lee, Collier, Sarasota and Pinellas fell between 11% and 19% in the year to August 2026, pending sales rose in all four, and median days on market fell everywhere except Pinellas. Asking prices are still declining, so buyers retain pricing leverage — but the inventory advantage that defined 2025 has been shrinking all year.
Why are asking prices still falling if inventory is shrinking?
Because the two respond on different clocks. Inventory reflects what is available right now; asking prices reflect what sellers and their agents concluded about the market over the preceding months. Prices in all four counties remain 14% to 24% below their 2022–2023 peaks, and the repricing that helped clear the glut is visible in those same numbers.
Which Gulf Coast county has tightened the most?
Collier. Its active listing count is down 44.1% from an April 2025 peak of 8,358, the steepest drawdown of the four, and its median days on market fell from 120 to 106. Sarasota is close behind at 40.8% off peak with the largest pending-sales increase, up 19.5%.
Where does this housing inventory data come from?
All figures are from Realtor.com's Housing Inventory Core Metrics, published monthly by county through the Federal Reserve Bank of St. Louis (FRED) and current through August 2026. "Active listings" counts single-family and condo or townhome listings on the market during the month and excludes pending listings. The series are not seasonally adjusted, so every comparison in this article is same-month, year over year.